INDICATORS
Powerful and easy to use

EXCLUSIVE TECHNICAL INDICATORS
Take advantage of other traders thanks to these exclusive technical Indicators, Global Trading Indicators is a powerful tool based on volatility analysis, it can be used in any TIME-FRAME, (minutes, days, etc.). The use of colors and different symbols will help you understand in a friendly and simple way without the use of complex formulas. Identify new trends, bull, and bear control zones. You can also identify depletion levels, risk areas, trailing stops, entry levels. Most indicators quickly adapt to market changes.
![]()
We currently have 11 indicators, which are based on our theory called (VERA) Volatility Explosion Relatively Adjusted; designed to predict the moment in which the volatility explosion will occur and thus obtain a first warning signal that generates a new investment strategy.
VERA BANDS
The user-friendly methodology that identifies trends. It must be used in conjunction with OHLC bars.
Color (Blue) bullish trend and Color (Magenta) bearish trend.
Vera Average: Market price of the reference area
Upper limit: upper band used as trailing stop for short positions
Lower limit: low band used as trailing stop for long positions
Red and green arrows – the entry point for long and short positions
Orange Triangles can be used in two ways:
- Profit-taking (usually overnight position)
- Volatility exposure alert where the stop or trailing stop must be established
Blue or magenta triangles: serve as a sign of re-entry into positions and/or confirmation of a trend
OHLC bars, Red (bearish), Green (bullish), Gray (Neutral)

VERA TREND SIGNALS
This indicator is based on the theory VERA- Volatility Explosion Relative Adjusted (it works in any period). It must be used with OHLC bars.
Line (blue): bullish stops area
Line (magenta): area of stops for a downtrend
Grayline (opening): entrance to the risk area
Green arrows: the signal of trend change (bullish or bearish)
Pink circle (possible exhaustion of the uptrend)
Olive green circle (possible exhaustion of the downtrend), can be used in two ways:
- As a profit-taking area (usually overnight position)
- As an alert zone where you can set the stop or trailing stop
The green or red arrows serve as an indicator for the re-entry of positions and / or to confirm the trend.
OHLC bars, red (bearish), green (bullish), gray (neutral)

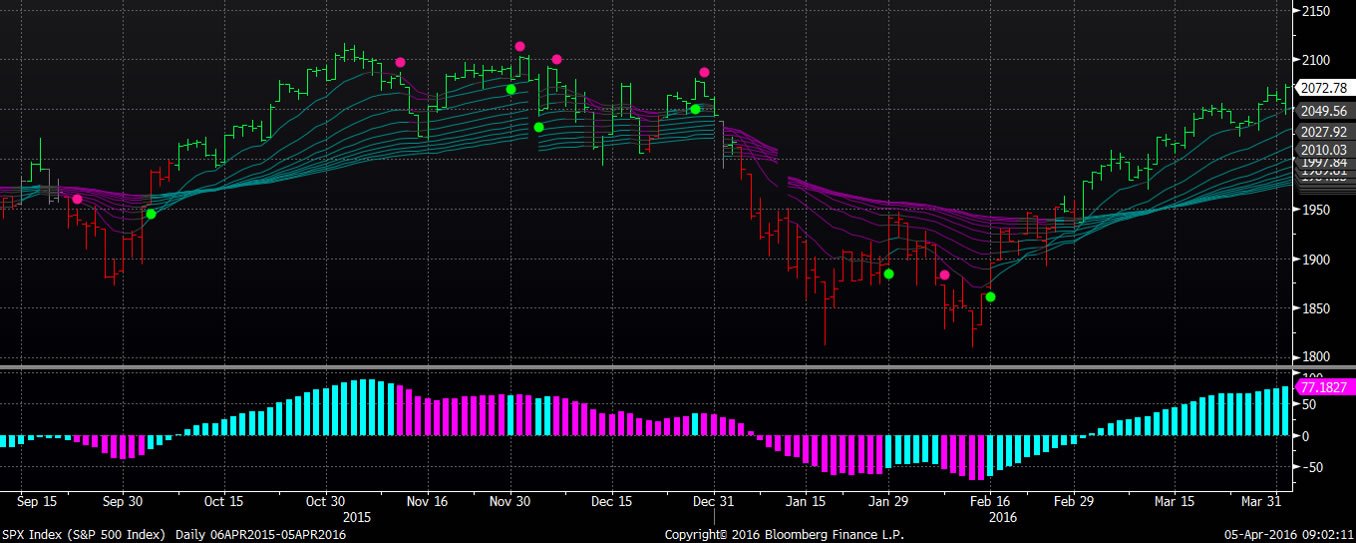
VERA RIBBON MAVG
In conjunction with the VERA WIDTH OSCILLATOR, it displays multiple modified moving averages using the Adjusted-Volatility Explosion theory. The different time windows of the moving averages are calculated using arithmetic gradients. In addition to this, the OHLC graph must be adjusted by the user to indicate the price trend both bullish (green) or bearish (red). If the moving averages are blue they indicate an upward trend and magenta a downtrend. The oscillator is accompanied by red (bearish) and green (bullish) circles displayed on the graph.
TREND REVERSAL INDICATOR TRI
This indicator shows directly on the graph the possible break or end of the current trend. Turquoise diamonds show the exhaustion of the downtrend, while pink diamonds show the weakening of the uptrend. Additionally, this indicator is accompanied by two strong levels: support (yellow) and resistance (light pink) which serve to determine the possible formation of choppy markets.

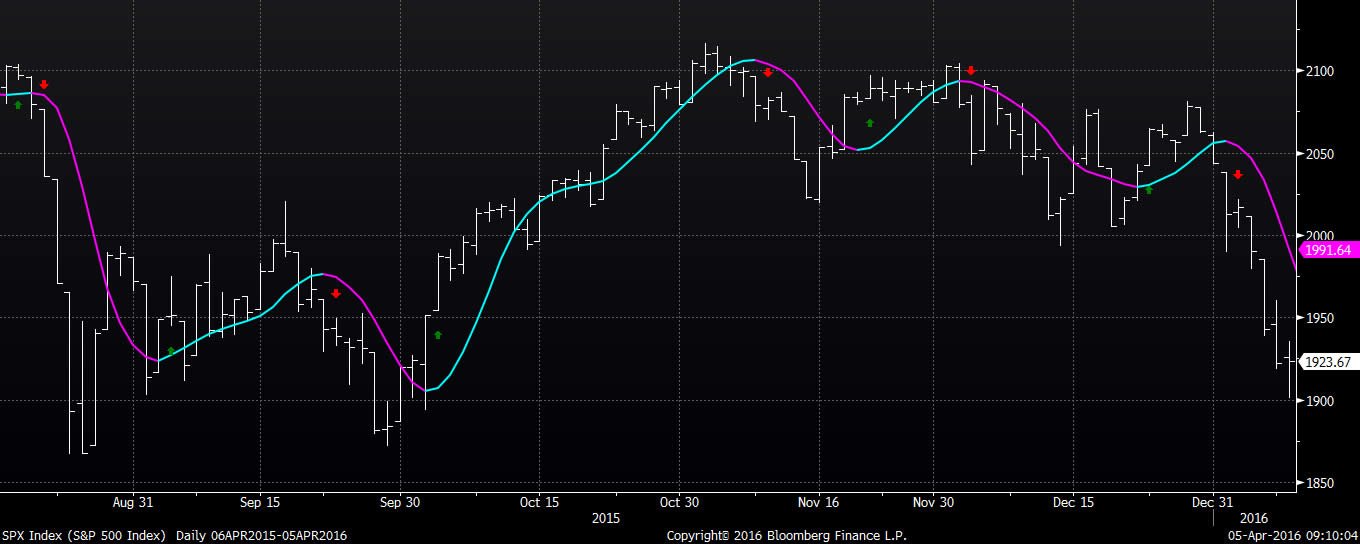
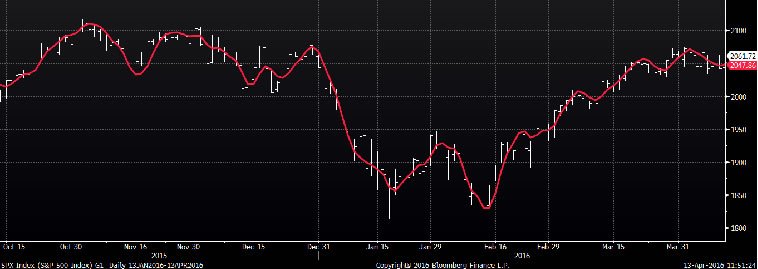
GLOBALTREND MOVING AVERAGE
Simultaneously it fulfills two functions: it smooths the movement of the price and provides a dynamic indicator with greater correlation. It was specially modified to obtain greater speed and to indicate with greater veracity the possible formation of an upward (blue) or downtrend (magenta) trend in the moving averages.
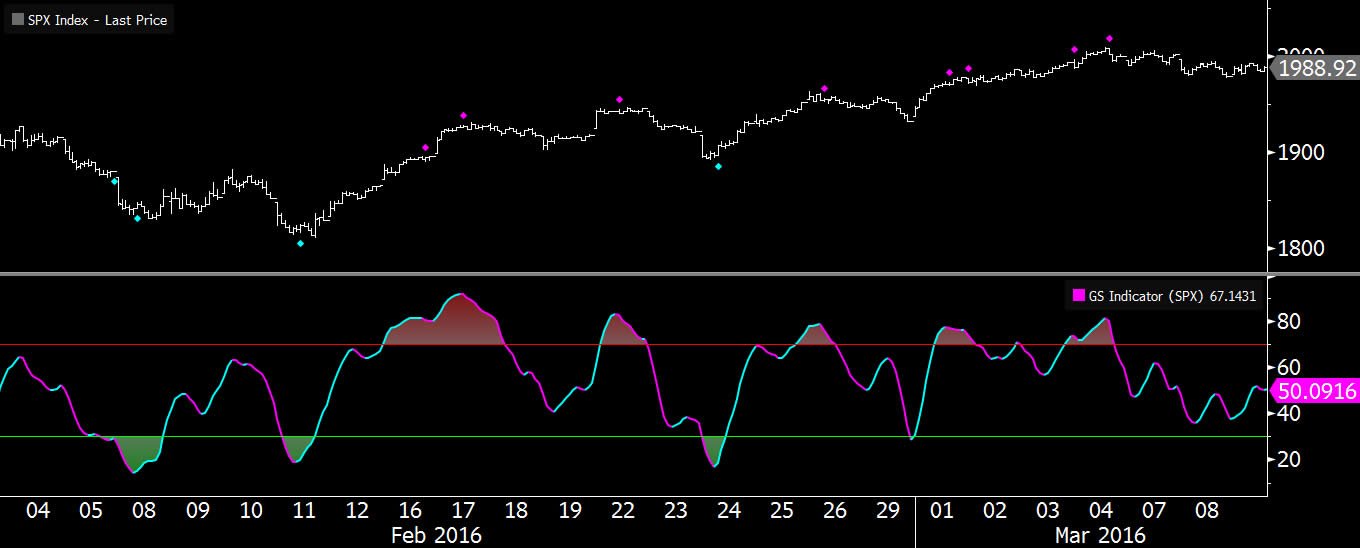
GLOBAL STRENGTH INDICATOR
This indicator, by its acronym GSI or smoothing oscillator, is a type of indicator that shows the strength of the price by comparing the individual movements up and down of successive closing prices. In addtion, it shows the uptrend (blue) or a downtrend (magenta) on the indicator and chart signals (diamonds).
SPEED MOVING AVERAGE
It serves as both a fast-moving average or a simple moving average offering a correlation between price behavior and time. The difference is evident in the calculation of the exponential moving average which evaluates recent data in a period greater than that usually used for the calculation of the simple moving average. This modification results in higher speed.
GSC RIBBON MOVING AVERAGES
The GSC Ribbon Moving Average is an indicator that shows multiple moving averages. The variation of them is based on geometric gradients. Also, the OHLC chart needs to be adjusted by the user, including both the uptrend (green) and the downtrend (red) within the chart.

WEATHER INDICATOR
It shows if buyers or sellers have control in the market easily. The indicator varies according to the strength of the trend, were weak forces are shown below and strong trends above (indicator: green-bulls and red-bear).

VERA EMAVG GTI
The adjusted moving average for the intraday market, which allows decision making just when the market opens or when intraday gaps are formed. It is similar to the moving average, except that this indicator provides a better fit when using the VERA – Adjusted Relative Volatility Explosion.

VERA Cvg Dvg
Indicator inspired by the MACD, modified to eliminate noise when applying the VERA- Adjusted Relative Volatility Explosion. It is useful in minute or hour charts, especially for stocks and ETFs which usually have unexpected changes or movements. Useful to detect the exhaustion of a trend.
