ABOUT US
GLOBAL TRADING INDICATORS
GLOBAL TRADING INDICATORS
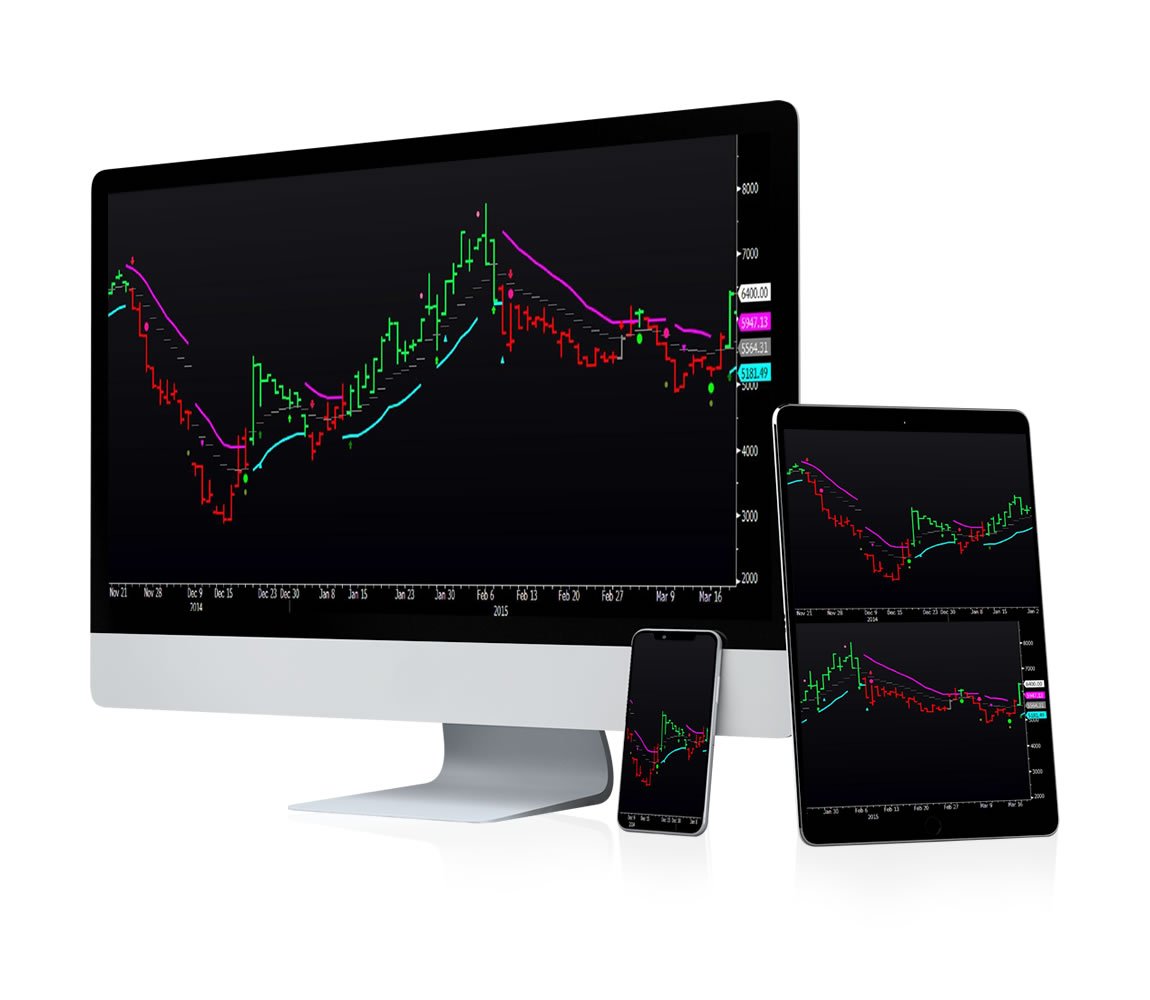
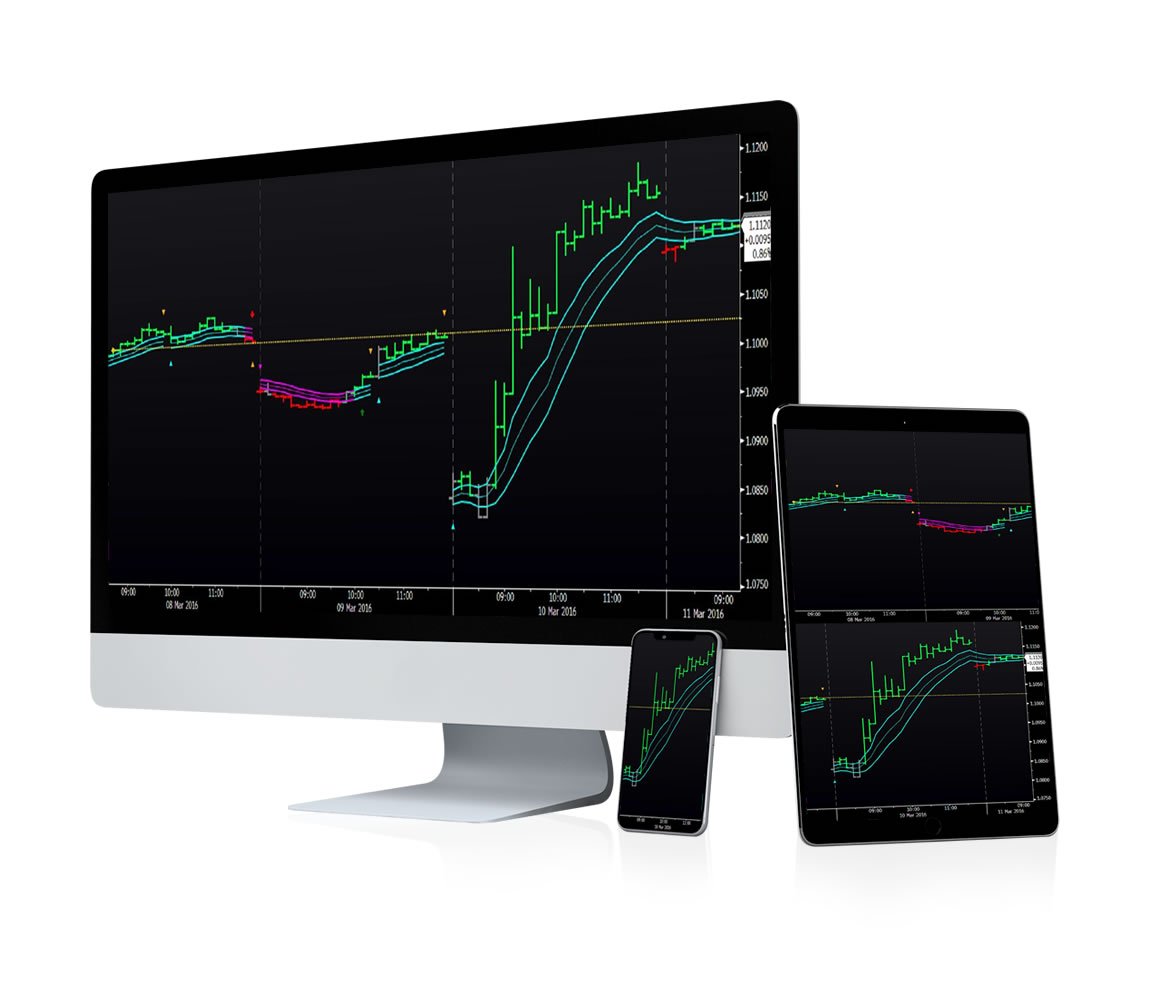
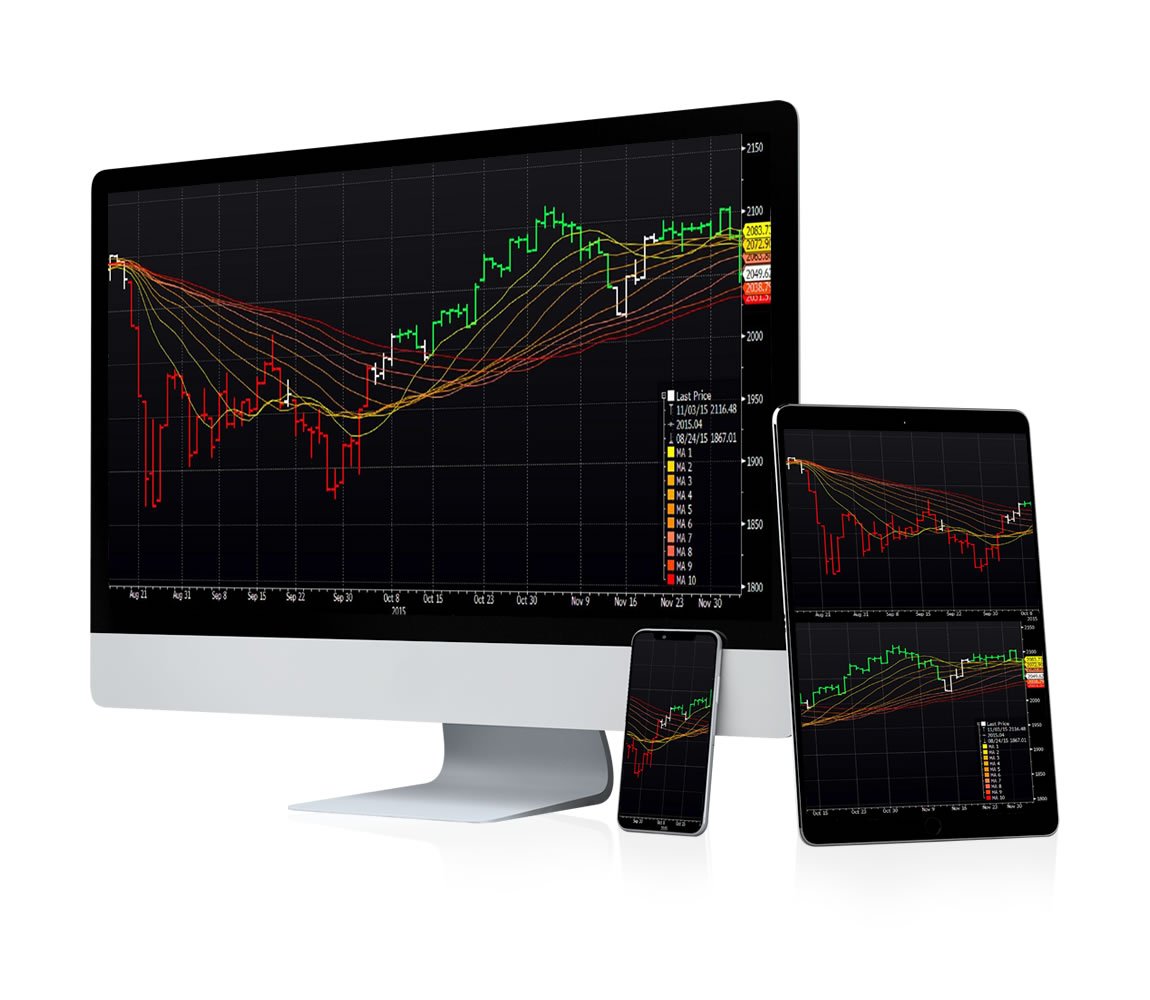
Take advantage of other traders thanks to these exclusive technical Indicators, Global Trading Indicators is a powerful tool based on volatility analysis, it can be used in any TIME-FRAME, (minutes, days, etc.). The use of colors and different symbols will help you understand in a friendly and simple way without the use of complex formulas. Identify new trends, bull, and bear control zones. You can also identify depletion levels, risk areas, trailing stops, entry levels. Most indicators quickly adapt to market changes.
Our goal is to provide a novel, different tool that provides real support in investment decision making, this tool has been developed by traders for traders, and is today one of the most cited by reporters from networks such as Bloomberg, and Forbes to analyze the most relevant events in the financial market worldwide, It is also indispensable support used by investment funds, hedge funds and other institutional investors for their investment decisions.
THEORY
One of the most difficult steps in making an investment decision is after a big movement in the market, which is called the “moment of explosion”. Sometimes these sudden movements are caused by fundamental changes, economic or political news that cause a significant variation in the monitored assets.
PREDICTABLE EVENTS
Almost everyday economic data is published for the United States, Asia, Europe, and Latin America. These macroeconomic data or corporate events can affect the evolution of prices of various assets. Despite this, analysts generally try to avoid this using many statistical techniques, however, it is not possible to accurately predict future movement. With the help of our adjusted indicators traders obtain a first warning signal to react and modify the investment strategy.
UNPREDICTABLE EVENTS
In the first type of event, the advantage is that the time and date of the event are known in advance and thanks to this the investor can decide whether or not to expose himself at the time of the explosion.
However, in this case the situation is totally unpredictable. These types of events are those that have caused large losses in the balance sheet of various investment funds, banks, and any other type of investor worldwide. (Example: terrorist attacks, an unexpected decision of a Central Bank)
In early 2015, the Swiss Central Bank unexpectedly abandoned the value of its euro fixed currency as a mechanism to protect its economy. This caused movements of over 20% in just seconds, generating an explosion of volatility and therefore, large losses for some market participants; This was the case of several trading platforms that almost declared bankruptcy because their clients did not have enough guarantees. The intention of these indicators is to answer the question of when to exit and when to enter the market again in order to limit losses and obtain profits.
FIRST PHASE: VOLATILITY EXPLOSION
It occurs when the market drastically changes its normal volatility pattern. The prediction of this moment of explosion is almost impossible; however, it is the first red flag to stop the loss or close
SECOND PHASE: CHAOS ZONE
It is the moment immediately after the volatility explosion. Generally, when the market panics or chaos there are no logical or foolproof tools to make consistent decisions, the decision made during the chaos zone produces random results. A large percentage of theinvestor`s decisions in this area are made based on impulse, a physiological action generated by a common human reaction. The real market problem is how to define:
How long is this period? A minute / ten minutes / or an hour? No one knows, and that is why after the moment of the explosion many traders continue to operate in the market. Technical indicators could fail and provide incorrect results because there is a wide gap in the sample that could be contaminated by uncertainty.
How to determine this moment? The chaos zone means the time when YOU MUST NOT MAKE ANY INVESTMENT, it will be determined at the beginning of the volatility explosion and then relatively adjusted.
THIRD PHASE: RELATIVE ADJUSTMENT OF VOLATILITY
(MOMENT OF CALM)
This is the time after the explosion and chaos when we must operate again in the market. It is precisely the moment when volatility adjusts or even begins its way to a normal situation. At this time, the risk of possible losses due to a highly volatile environment would be less than the risk in the death zone. The technical indicators can resume their calculation maintaining the previous parameters of the explosion moment. This is the exact time to restart operations and continue to apply traditional technical analysis and observe the relative volatility adjustment after the explosion.


